The Need for Time Series Anomaly Detection in Azure
Time series data (data points collected over time, typically at regular intervals) is present in most modern cloud applications, from telemetry and sensor readings to application logs and financial metrics. Detecting anomalies in this type of data is essential for identifying issues early, before they lead to downtime, data loss, or financial impact. In many cases, real-time detection is critical, such as in monitoring IoT devices or transaction systems.
Azure users need solutions that can scale with their workloads and process large volumes of streaming or historical data. The goal may be to monitor performance, detect fraud, or optimize operations. Anomaly detection tools must handle seasonal patterns, multivariate inputs, and custom thresholds—often with minimal manual intervention.
What Are the Options for Anomaly Detection in Azure?
Until recently, Azure AI Anomaly Detector was the go-to option for time series anomaly detection in Azure. However, with its deprecation and impending retirement, users must seek alternatives. One option within the Azure ecosystem is the PCA (Principal Component Analysis)-based anomaly detection module in Azure Machine Learning designer. It allows users to build custom models using principal component analysis, but requires more setup and knowledge of machine learning.
For Microsoft-native solutions, other tools like Azure Stream Analytics, Azure Data Explorer, and Microsoft Fabric now fill the gap for various use cases. For teams looking beyond Microsoft’s native offerings, Umbrella provides an integrated anomaly detection platform that works seamlessly with Azure. It supports multivariate time series analysis, alerting, and customizable models. Umbrella can ingest data from Azure services and deliver an end-to-end monitoring solution.
Azure AI Anomaly Detector Is Being Retired
Azure AI Anomaly Detector, formerly the primary Azure offering for anomaly detection, is a cloud service that identifies anomalies in time series data using machine learning models. It detects irregular patterns, such as unexpected fluctuations in revenue, sensor readings, or application performance metrics, without requiring expertise in data science.
Azure AI Anomaly Detector is being retired, with new resource creation disabled as of September 20, 2023. Existing users can continue using the service until its full retirement on October 1, 2026. While Microsoft hasn’t provided a formal explanation for the retirement, it aligns with the company’s broader trend of transitioning capabilities into core platforms, such as Azure Fabric, Azure Data Explorer, and Azure Machine Learning. These platforms offer more integrated, scalable, and flexible anomaly detection features, making them natural successors to the standalone Anomaly Detector API.
5 Azure Anomaly Detection Alternatives
With the retirement of Azure AI Anomaly Detector, Azure offers several alternative solutions for anomaly detection in time series data.
1. PCA-Based Anomaly Detection in Azure Machine Learning Designer
This method uses principal component analysis (PCA) to reduce the dimensionality of time series data and identify outliers. It’s suitable for multivariate scenarios where anomalies are defined by correlations across features, rather than by individual metric deviations.
The PCA module is part of Azure Machine Learning designer’s drag-and-drop interface, making it accessible without writing code. However, users must prepare their data manually, define thresholds, and interpret results—requiring some understanding of unsupervised learning techniques.
2. Anomaly Detection with Microsoft Fabric
Microsoft Fabric introduces a new package—time-series-anomaly-detector—that replicates the functionality of the retired Azure AI Anomaly Detector. It enables multivariate anomaly detection using Spark and inline Python, and integrates directly with Eventhouse for real-time data ingestion.
The package supports training custom models, deploying them with MLflow, and running predictions through KQL functions. It’s especially well-suited for users already leveraging Microsoft Fabric for analytics pipelines and looking to build advanced anomaly detection into streaming or historical time series analysis.
3. Azure Stream Analytics for Anomaly Detection
Azure Stream Analytics is a real-time event processing service designed for continuous data analysis. It detects anomalies such as spikes, dips, and change points using built-in functions. This makes it well-suited for applications requiring immediate anomaly detection, such as fraud detection, IoT monitoring, and financial transactions.
One of its key advantages is its integration with Azure Machine Learning Studio, enabling users to incorporate custom machine learning models for more advanced detection scenarios. However, it has limitations when it comes to handling seasonality and decomposition of time series data.
4. Azure Data Explorer for Anomaly Detection
Azure Data Explorer is optimized for large-scale data exploration and near real-time analytics. It offers native anomaly detection functions that analyze trends, seasonality, and outliers in high-volume time series data.
Unlike Stream Analytics, Data Explorer supports automatic seasonality detection, decomposition of time series components, and root cause analysis.
For anomaly detection, Data Explorer provides:
- Spike and dip detection using an enhanced seasonal decomposition model.
- Changepoint detection for identifying level shifts and trend changes.
- Custom anomaly models via KQL inline Python/R plugins for advanced scenarios.
5. Anomaly Detection with Umbrella
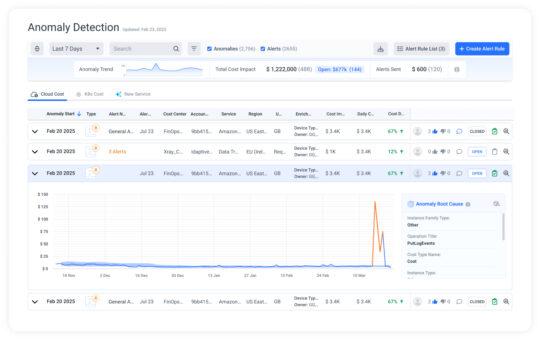
Umbrella is a cloud cost anomaly detection tool that works with Azure, helping FinOps teams stay on top of unexpected spending. The all-in-one FinOps platform monitors cloud cost data in real-time, flags unusual spikes or drops, and notifies the relevant teams when action is needed.
Instead of flooding your team with alerts, Umbrella highlights only the most important anomalies, such as sudden spikes in storage costs or unexpected increases in data transfer fees, making it easier to take action quickly and avoid budget surprises.
What You Can Do with Umbrella
- Automatically detect cost anomalies across your cloud environment without needing to set manual thresholds.
- Find the root cause fast, with charts and explanations that show how the anomaly developed and what contributed to it.
- Track and manage anomalies in one place. Add notes, labels, and feedback to help your team stay organized and learn from past issues.
- Set up custom alerts for specific accounts, services, or cost centers. You can choose who gets notified and how, whether it’s through email, Slack, or Microsoft Teams.
With automated alerts, root-cause insights, and flexible workflows, we help FinOps teams stay on top of cloud spending and respond quickly when something goes off track.
Talk to us about anomaly detection for FinOps
Tutorial: Setting Up a Time Series Anomaly Detector in Microsoft Fabric
With the retirement of Azure AI Anomaly Detector, Microsoft Fabric offers a new approach to detecting anomalies in time series data. This tutorial demonstrates how to use Fabric’s time-series-anomaly-detector package to train and deploy a multivariate anomaly detection model for stock price changes. Instructions are adapted from this Microsoft Tech Community blog post.
Step 1: Setting Up the Environment
To begin, set up the necessary Fabric components:
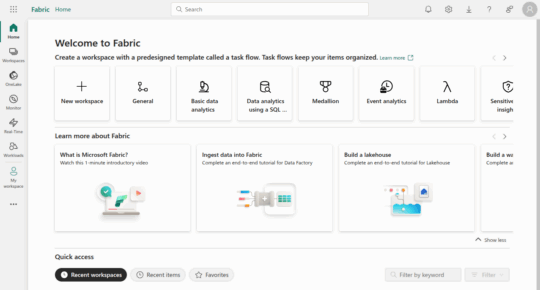
- Login to Microsoft Fabric.

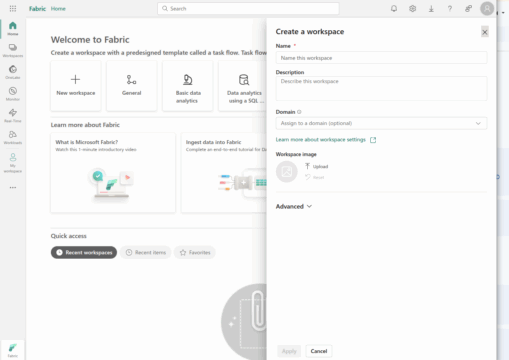
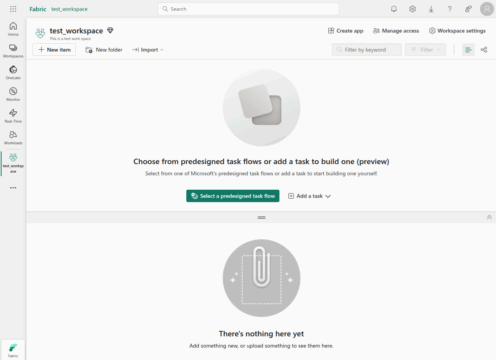
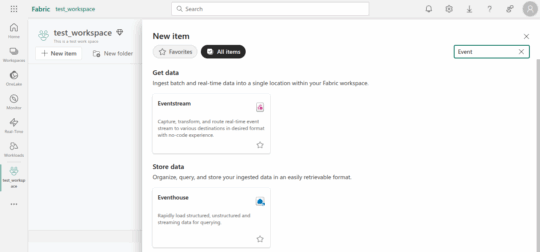
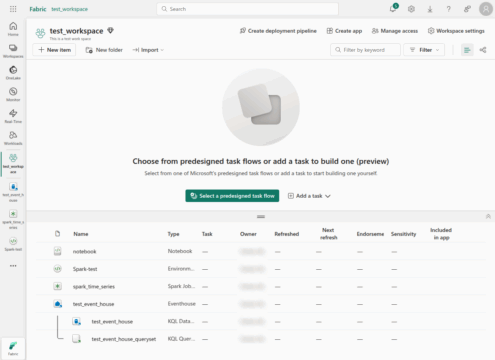
- Create a Workspace in Fabric.


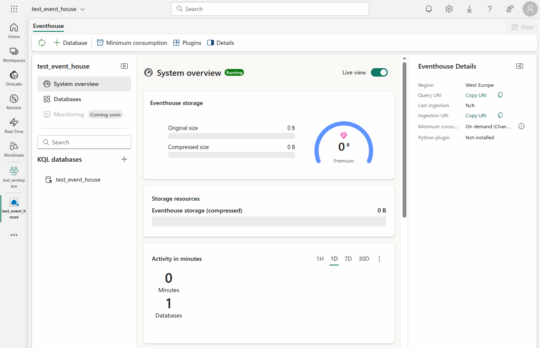
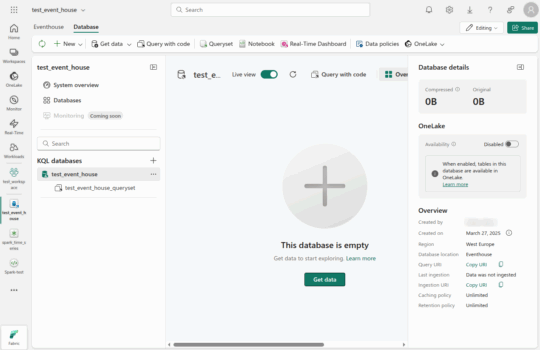
- Create an Eventhouse to store streaming data.


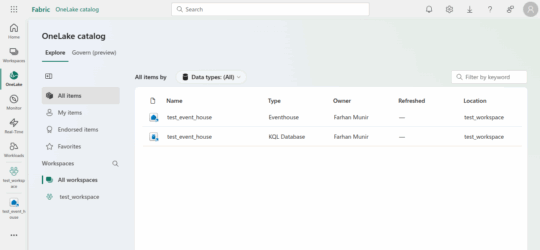
- Enable OneLake availability to ensure older data is accessible for training.

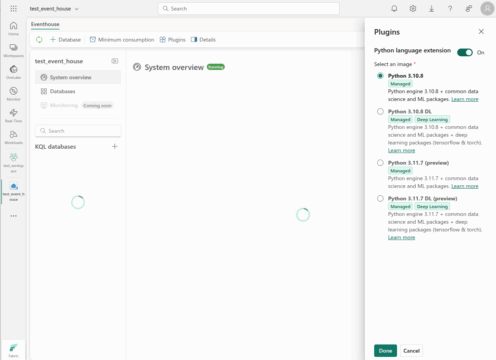
- Enable the KQL Python plugin to run inline Python code for real-time anomaly detection.
- Create a Spark environment with the time-series-anomaly-detector package installed.
Step 2: Loading and Visualizing Data
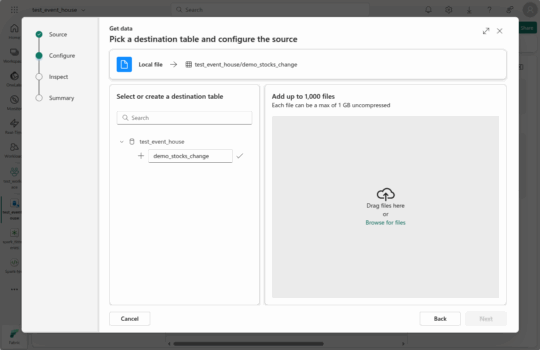
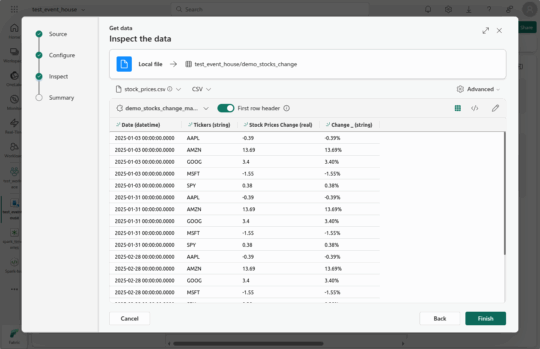
Upload a stock price dataset to Fabric’s Eventhouse.
Then, load it into a Spark dataframe and visualize the data.
Note: Please ensure that CSV columns don’t have any spaces in column names.
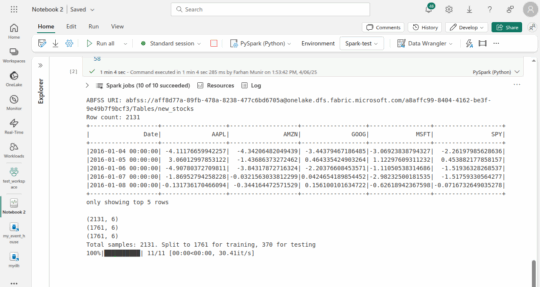
Loading the Data
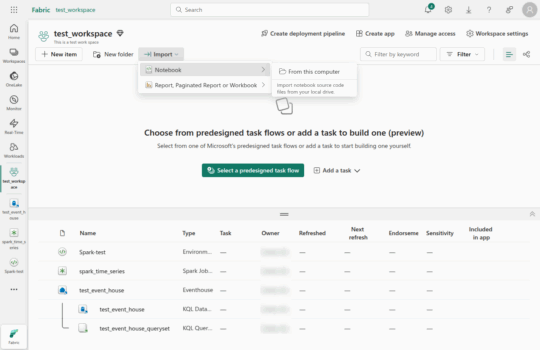
Store code in a python file (let’s call it notebook.py) and add it to the workspace as shown in the following screenshot(s):
onelake_uri = "YourOneLakeTableURI"
abfss_uri = convert_onelake_to_abfss(onelake_uri)
df = spark.read.format('delta').load(abfss_uri)
df = df.toPandas().set_index('Specified-date')
Please note method convert_onelake_to_abfss is defined as follows:
def convert_onelake_to_abfss(onelake_uri):
if not onelake_uri.startswith('https://'):
raise ValueError("Invalid OneLake URI. It should start with 'https://'.")
uri_without_scheme = onelake_uri[8:]
parts = uri_without_scheme.split('/')
if len(parts) < 3:
raise ValueError("Invalid OneLake URI format.")
account_name = parts[0].split('.')[0]
container_name = parts[1]
path = '/'.join(parts[2:])
abfss_uri = f"abfss://{container_name}@{parts[0]}/{path}"
return abfss_uri
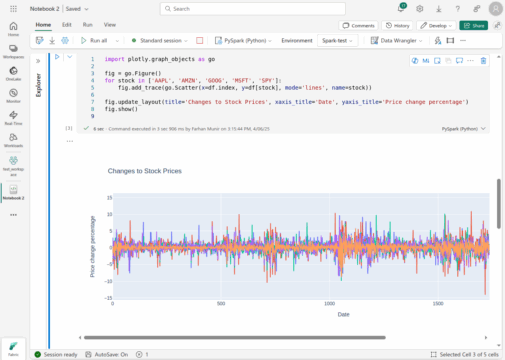
Visualizing Stock Price Changes
import plotly.graph_objects as go
fig = go.Figure()
for stock in ['AAPL', 'AMZN', 'GOOG', 'MSFT', 'SPY']:
fig.add_trace(go.Scatter(x=df.index, y=df[stock], mode='lines', name=stock))
fig.update_layout(title='Changes to Stock Prices', xaxis_title='Date', yaxis_title='Price change percentage')
fig.show()
Step 3: Training the Anomaly Detection Model
Prepare the dataset for training and initialize the multivariate anomaly detection model.
Preparing the Data
import pandas as pd
features_cols = ['AAPL', 'AMZN', 'GOOG', 'MSFT', 'SPY']
cutoff_date = pd.to_datetime('2024-05-10')
train_df = df[df.index < cutoff_date]
Training the Model
import mlflow
from anomaly_detector import MultivariateAnomalyDetector
model = MultivariateAnomalyDetector()
params = {"sliding_window": 300}
model.fit(train_df, params=params)
Saving the Model in Fabric ML Registry
with mlflow.start_run():
mlflow.log_params(params)
mlflow.set_tag("Training data", "Stock Prices Dataset")
model_info = mlflow.pyfunc.log_model(
python_model=model,
artifact_path="mvad_artifacts",
registered_model_name="stock_prices_model",
)
Step 4: Deploying the Model for Real-Time Predictions
Retrieve the saved model path and integrate it with Fabric’s Eventhouse for anomaly detection.
Retrieving the Model Path
mi = mlflow.search_registered_models(filter_string="name='stock_prices_model'")[0]
model_abfss = mi.latest_versions[0].source
print(model_abfss)
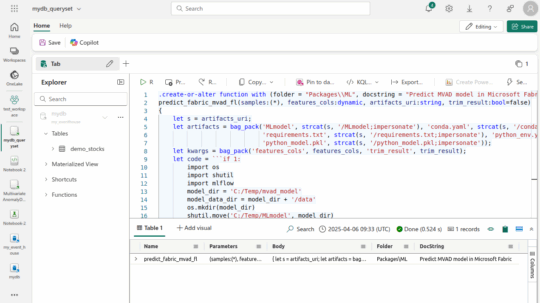
Defining the Prediction Function in KQL
.create-or-alter function with (folder="Packages\\ML", docstring="Predict MVAD model in Microsoft Fabric")
predict_fabric_mvad_fl(samples:(*), features_cols:dynamic, artifacts_uri:string, trim_result:bool=false)
{
let s = artifacts_uri;
let artifacts = bag_pack(
'MLmodel', strcat(s, '/MLmodel;impersonate'),
'python_model.pkl', strcat(s,
'/python_model.pkl;impersonate')
);
let kwargs = bag_pack('features_cols', features_cols, 'trim_result', trim_result);
let code = ```if 1:
import os, shutil, mlflow, pandas as pd
model_dir = 'C:/Temp/stock_prices_model'
os.mkdir(model_dir)
shutil.move('C:/Temp/MLmodel', model_dir)
model = mlflow.pyfunc.load_model(model_dir)
test_data = df[features_cols]
predictions = model.predict(test_data)
predict_result = pd.DataFrame(predictions)
result = df
result.iloc[-len(predict_result):, -4:] = predict_result.iloc[:, 1:]
```;
samples | evaluate python(typeof(*), code, kwargs, external_artifacts=artifacts)
}
Note: Please ensure the Python plugin is installed for KQL Database.
Running the Anomaly Detection Query
let cutoff_date=datetime(2024-05-10);
let num_predictions=toscalar(demo_stocks_change | where Date >= cutoff_date | count);
let sliding_window=200;
let num_samples = sliding_window + num_predictions;
demo_stocks_change
| top num_samples by Date desc
| order by Date asc
| extend is_anomaly=bool(false), score=real(null)
| invoke predict_fabric_mvad_fl(pack_array('AAPL', 'AMZN', 'GOOG', 'MSFT', 'SPY'),
artifacts_uri='model URI', trim_result=true)
| render anomalychart with(anomalycolumns=is_anomaly, title='Changes of Stock Prices with Anomalies')
By leveraging the time-series-anomaly-detector package in Microsoft Fabric, users can efficiently detect anomalies in time series data using the same core algorithms as Azure AI Anomaly Detector.
Conclusion
With Azure AI Anomaly Detector being retired, users must shift to other tools within or integrated with Azure. While no single solution directly replaces all of Anomaly Detector’s capabilities, Microsoft Fabric, Azure ML, Stream Analytics, and third-party platforms provide strong alternatives, depending on the data architecture, technical skills, and detection needs.